Intro – For the outsider
Wow, what a title. As you can probably guess, this has something to do with my MD thesis, and touches on statistics. So if you are not into the topic here is a small summary: Most basically, coherence is a meassure of the dependency of two time-signals over the frequency, where a coefficent of 1 expresses total lineaer dependency. This is used in neuroscience to research the coupling between cortical activity and excitment of motor neurons (then called Corticomuscular Activity (CMC)).
Intro
The pre-post comparision of CMC values is not so easy, mainly due to the multiple comparison problem. During my MD-thesis the following situation arose: 64 eeg-channels with 50 frequency bins wanted to be pre-post tested. This makes for 3200 comparisions, which using the Bonferiore correction leads to an incredible small p-value.
As always, you are propably not the first one running into this problem and searching for an alternative and luckily for all of use, the good folks of the MNE toolbox (https://mne.tools/stable/index.html) already implemented the solution to our problem: Cluster permutation testing.
How does it work?
This is really clever and the basic principle is explained really well in Maris 2007a, so only a short summary is given here:
- You define a test statistic (e.g. a t-test)
- You take the two groups you want to compare and put them in a single set
- You permute the set and create two new sets (which are mixed and contain items from both original groups)
- You calculate your test statistic
- You do the last two steps a loooot of times
- You create a histogram and and compare how many of the random sets have a higher test statistic than your original dataset. The calculated proportion of random sets greater than the observed set is your monte-carle-p-value you can compare to your alpha
For more on testing differences of coherence, I recommand: Maris 2007b. Just remember, that as coherence is a bound meassure [0;1], you can´t compare against zero, you would need to write your own test statistic.
Which test statistic to use?
The mne.stats.permutation_cluster_test function uses an ANOVA, which is bad luck for us, as pre-post data happens to be dependent data. So the first intuition would be using a dependent t-test, and looking into the literatur this gut feeling is confirmed.
Reiterer (2005): independent t-test to compare two groups
Schoffelen (2011): independent t-test to compare two groups
Mamashli (2019): Paired t-test
How to
With the mne.stats.permutation_cluster_1samp_test function this is really easy. We take the difference between our pre and post values (t test on the difference is identical to a dependent t test) and let MNE do its magic. If we plot the test-statistics and use the information of the indices of significant differences as a mask we can plot a nice topomap:
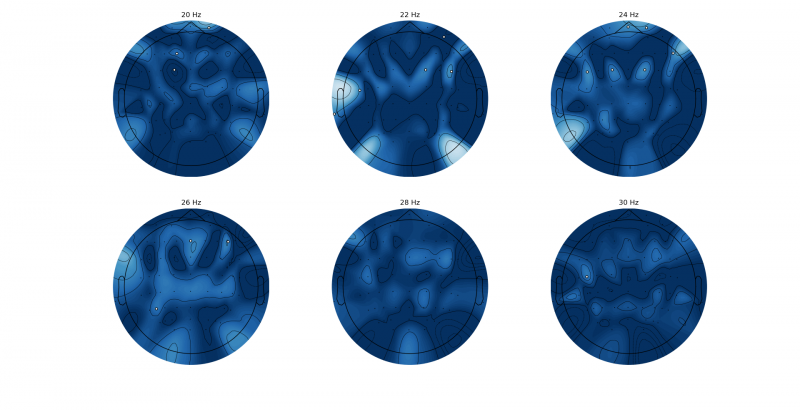
Topoplot of the test statistic, the white points mark the found clusters. You can later on check their significance, but as one can guess, they were non-significant.
Still a fascinating approach.
# iterate over the frequencys of interest
for i, f in enumerate([20, 22, 24, 26, 28, 30]):

    # create the required mne info object, from a list of channel labels
    mneInfo = mne.create_info(ch_names=chan_labels_ref[:64], sfreq=1000,
                    ch_types='eeg')
    ten_twenty_montage = mne.channels.make_standard_montage('standard_1020')
    mneInfo.set_montage(ten_twenty_montage)
    ch_adjacency, ch_names = mne.channels.find_ch_adjacency(mneInfo, ch_type = None)

    # do the actual statistical testing (iterates over the coherence differences by
    # frequency
    test_stat, clusters, cluster_p_values, h0 = mne.stats.permutation_cluster_1samp_test(
        diff[:, i, :],
        adjacency = ch_adjacency,
        out_type="indices",
        #threshold=threshold_tfce,
        #stat_fun = stat_fun_hat,
        n_permutations=1024)

    # the initial approach with the provided indices did not work, so created
    # own mask
    mask = [False]*64
    for c in clusters:
        for d in np.array(c).flatten():
            mask[d] = True

    axs.flatten()[i].set_title(f"{f} Hz")
    plot_topomap(data = np.mean(diff[:,i,:], axis=0),
                 pos = mneInfo,
                 outlines = "head",
                 cmap = cm.get_cmap("RdBu_r", 100),
                 vmin = 0,
                 vmax = 0.05,
                 mask = np.array(mask),
                 axes = axs.flatten()[i])
Sources
Mamashli, F., Hämäläinen, M., Ahveninen, J., Kenet, T., & Khan, S. (2019). Permutation Statistics for Connectivity Analysis between Regions of Interest in EEG and MEG Data. In Scientific Reports (Vol. 9, Issue 1). Springer Science and Business Media LLC. https://doi.org/10.1038/s41598-019-44403-z
Maris, E., & Oostenveld, R. (2007a). Nonparametric statistical testing of EEG- and MEG-data. In Journal of Neuroscience Methods (Vol. 164, Issue 1, pp. 177–190). Elsevier BV. https://doi.org/10.1016/j.jneumeth.2007.03.024
Maris, E., Schoffelen, J.-M., & Fries, P. (2007b). Nonparametric statistical testing of coherence differences. In Journal of Neuroscience Methods (Vol. 163, Issue 1, pp. 161–175). Elsevier BV. https://doi.org/10.1016/j.jneumeth.2007.02.011
Reiterer, S., Berger, M. L., Hemmelmann, C., & Rappelsberger, P. (2005). Decreased EEG coherence between prefrontal electrodes: a correlate of high language proficiency? In Experimental Brain Research (Vol. 163, Issue 1, pp. 109–113). Springer Science and Business Media LLC. https://doi.org/10.1007/s00221-005-2215-z
Schoffelen, J.-M., Poort, J., Oostenveld, R., & Fries, P. (2011). Selective Movement Preparation Is Subserved by Selective Increases in Corticomuscular Gamma-Band Coherence. In Journal of Neuroscience (Vol. 31, Issue 18, pp. 6750–6758). Society for Neuroscience. https://doi.org/10.1523/jneurosci.4882-10.2011