I was only going to watch a video.
Like many of my projects, this one started with a YouTube video and turned into something considerably larger. In this case, a full engineering bachelor’s thesis.
I came across Benn Jordan’s video on motion amplification and was mesmerised. Tiny, apparently invisible movements suddenly became obvious. It looked almost too good to be true, and I knew I wanted to play with it. Unfortunately, wanting to experiment with something does not automatically create the time to do so. Onto the project list it went.
Hold on. What is motion amplification?
Motion amplification is a video-processing technique that reveals and exaggerates small movements that would normally be difficult or impossible to see. The information is already in the recording; the software makes it easier to observe.
One particularly ridiculous example is the visual microphone: researchers recovered speech from the tiny vibrations of a bag of crisps. Someone talks, the sound makes the bag vibrate, and those vibrations can be analysed to recover some of the audio. From video. Of a bag of crisps.[1]
This takes suitable footage and specialised processing—the well-known demonstrations used high-speed cameras. It is not a feature hiding in every ordinary phone recording. Still, as reasons to fall down a signal-processing rabbit hole go, it is a fairly convincing one.
By a very convenient stroke of luck, I then learned that one institute was considering motion amplification for a project. That sounded like an excellent arrangement: I could finally experiment with the topic and finish my bachelor’s degree at the same time. Amazing.
With a degree in medical engineering to finish, the next question was obvious: could the same idea be useful in medicine? Breathing moves the chest, and pulse waves produce much smaller movements at the body surface. That became the direction of my thesis. First, though, I needed to understand what the algorithm was actually doing.
How does it work?
The basic idea is surprisingly approachable. The classical methods I used assume a stationary camera. Instead of following an image feature from one pixel to the next, they examine how the image changes over time at fixed locations.
Imagine a dark edge moving slightly across a light background. Even if the movement is smaller than a pixel, it changes how much light reaches the pixels around the edge. Those small changes contain information about the motion.
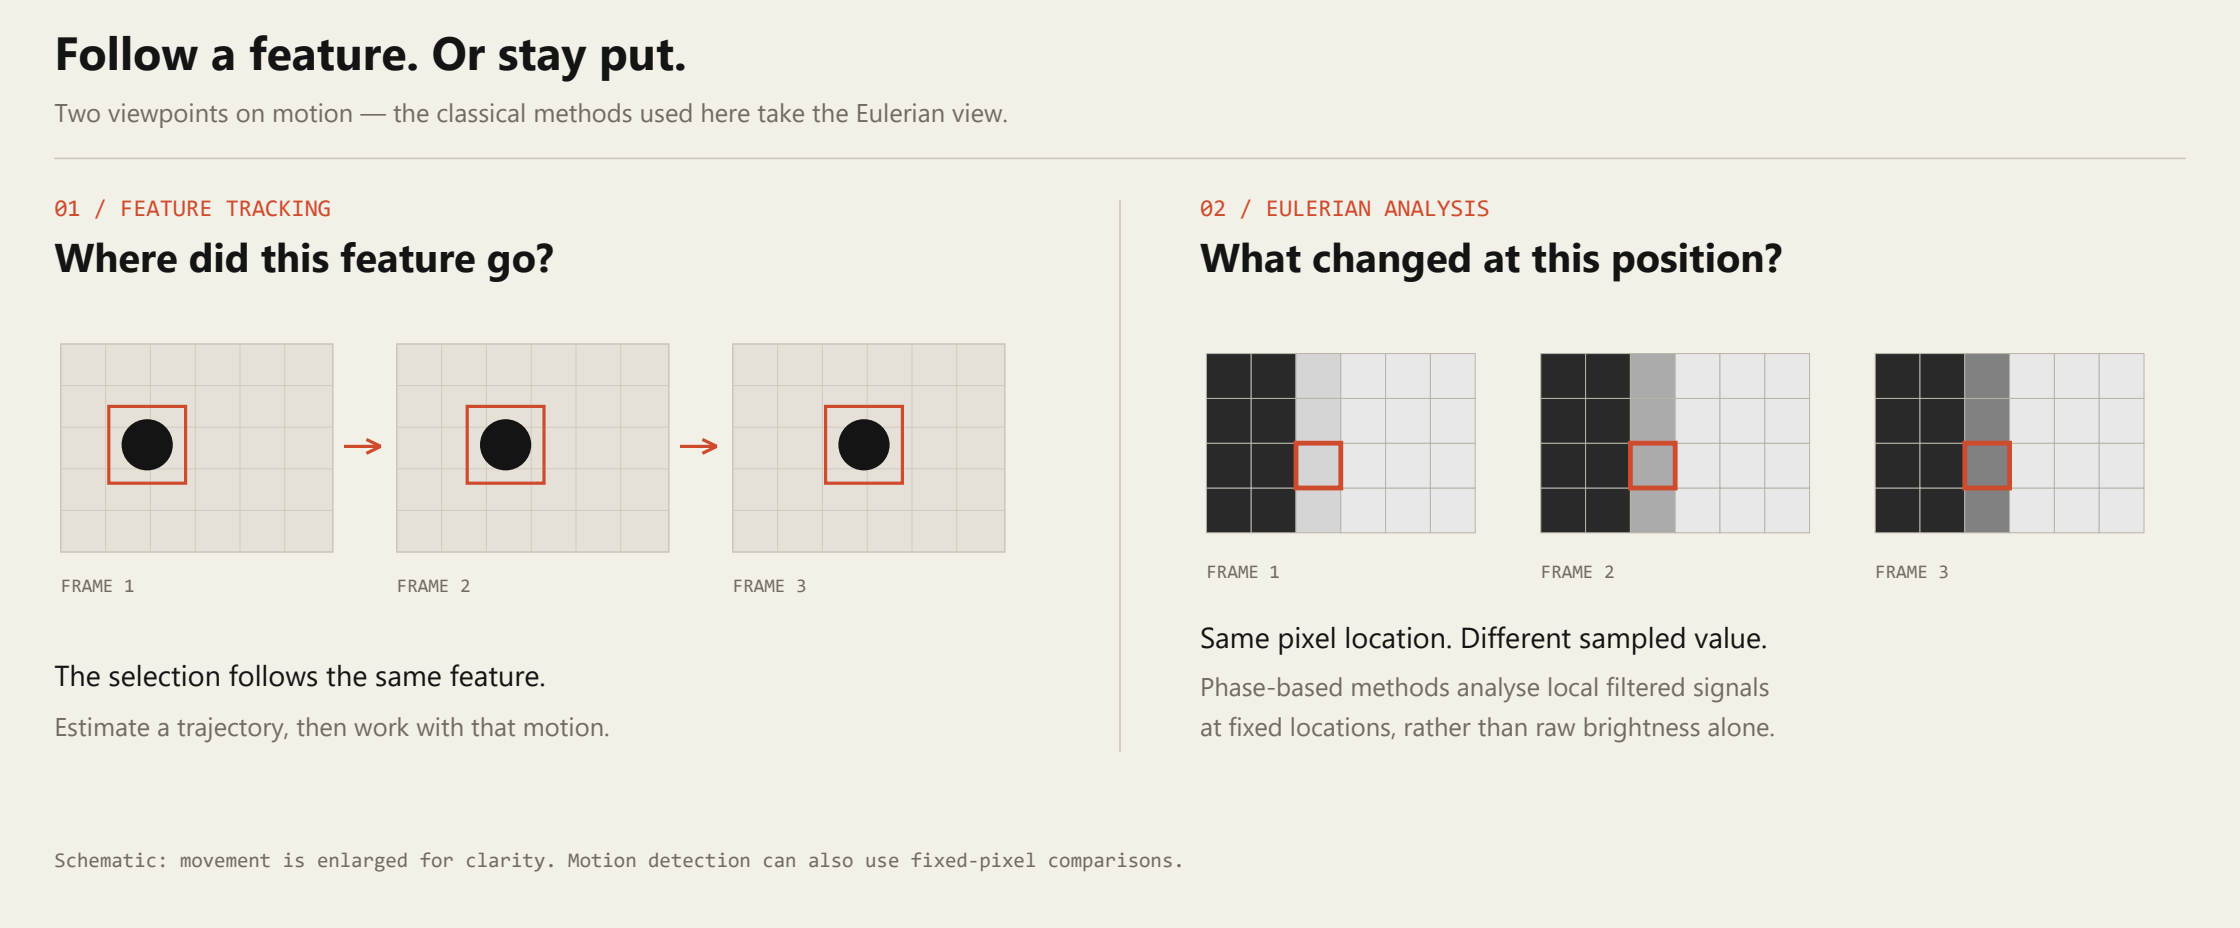
This is the Eulerian viewpoint. The phase-based version adds an important step: rather than simply multiplying changes in raw brightness, it analyses the phase of local, filtered image patterns. That is where things get more interesting.[2]
First, build a pyramid.
We start by separating each video frame into several levels of spatial detail. This gives us an image pyramid, and doing it for every frame gives us a video pyramid. “Spatial band-pass filtering” sounds rather grand, but the basic idea is quite visual.
Take a picture of a cat. Blur it slightly and scale it down, then scale the smaller picture back up. It is still recognisably a cat, but some of the fine detail has disappeared. Subtract this coarse approximation from the original and you get a detail image: whiskers, sharp edges and other structures that did not survive the reduction.
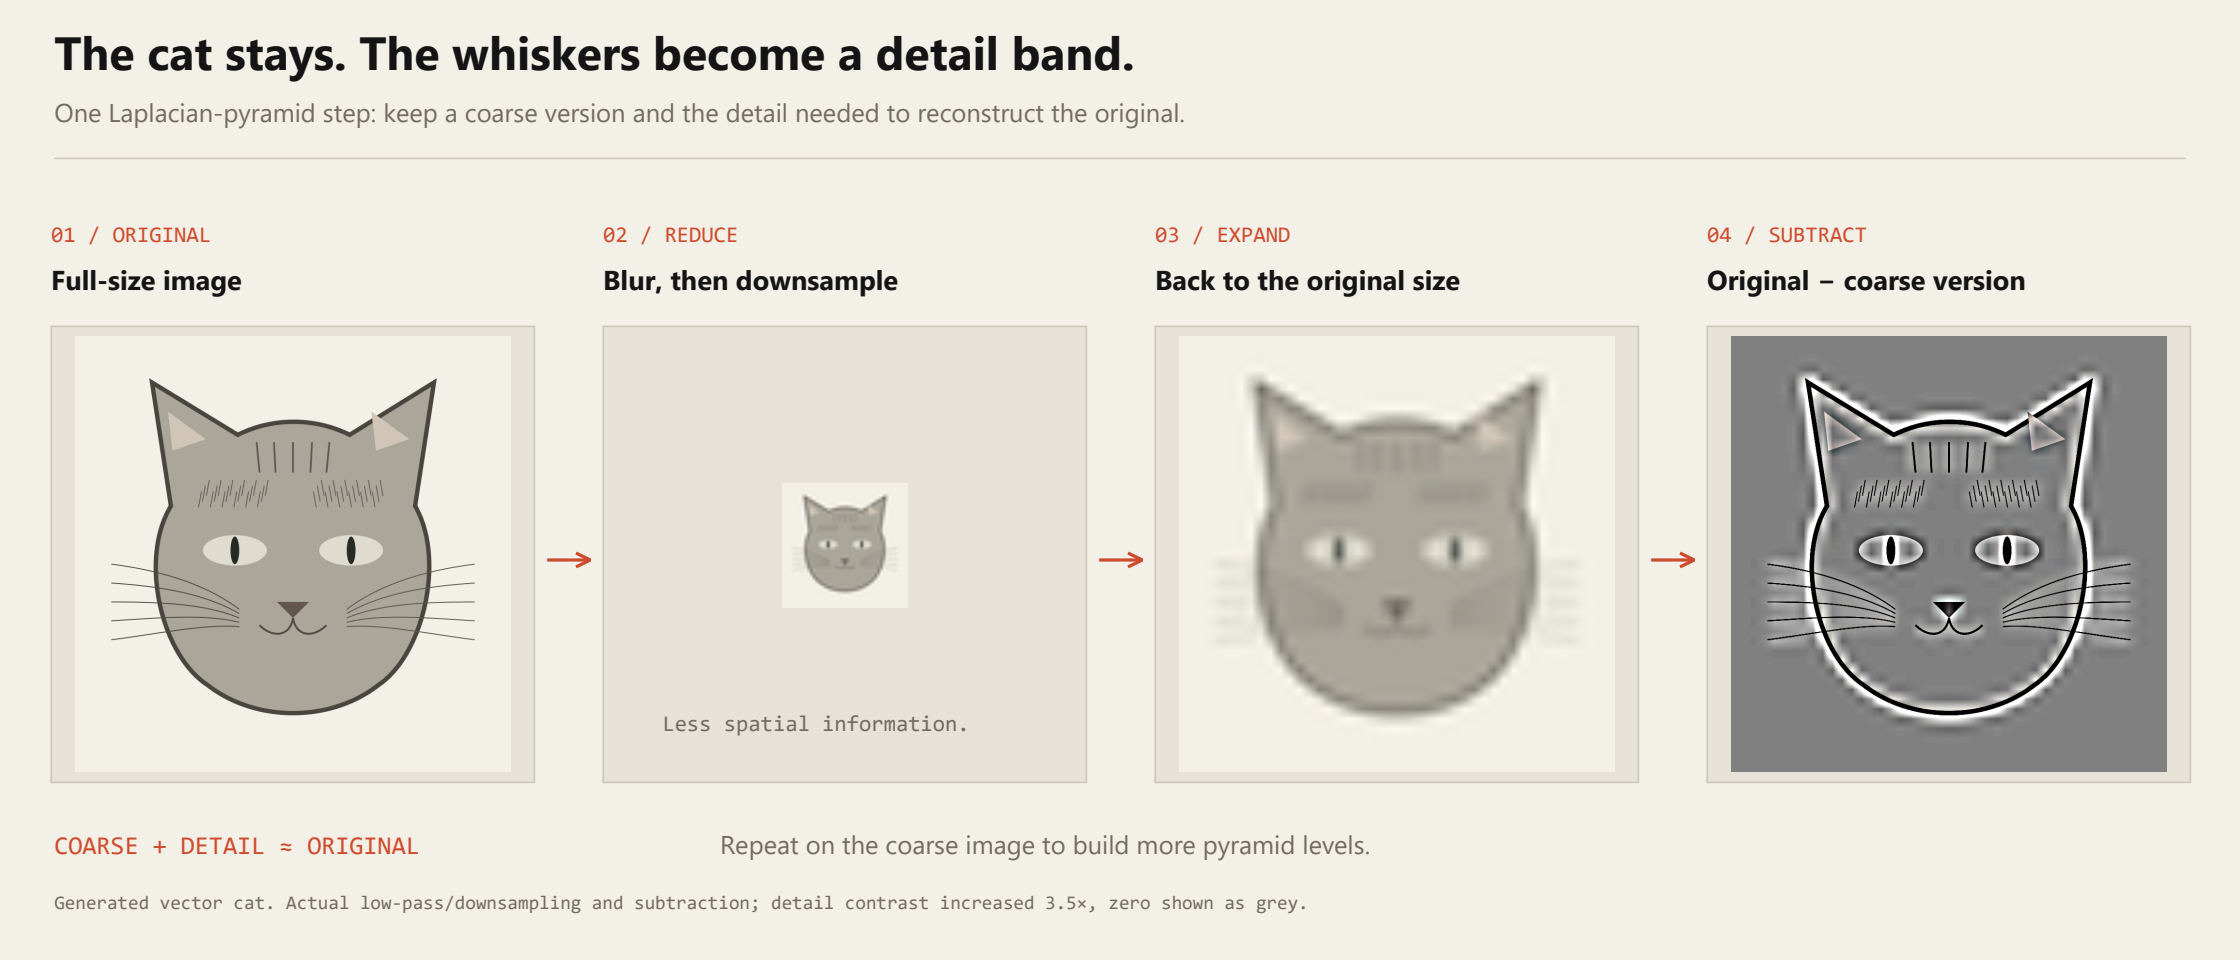
Repeat this with the coarse image and you separate progressively larger structures. Keep the detail bands and the final coarse image, and you have the ingredients needed to reconstruct the original. More elaborate pyramids also separate structures by orientation.[2]
That matters because the same movement has a different effect on fine whiskers than on the broad outline of the cat’s head. Working at several scales lets us process those structures appropriately before putting the image back together.
Finding the phase.
I focused on classical phase-based motion amplification. There are also learning-based approaches, including the 3D method using neural radiance fields discussed in my thesis.[4] Interesting stuff, but a more computationally involved direction than I wanted to take for this project. My priority was a practical test system and a path towards fast processing.
For phase-based processing, we need a representation that describes the local image patterns in terms of amplitude, phase and direction. These are properties of the filtered image bands around each position, not something a single raw pixel possesses on its own.
There are several ways to get there. A complex steerable pyramid uses directional filters to analyse structures at multiple scales and orientations. A Riesz pyramid provides a more compact representation of oriented local phase, making it attractive when processing time matters.[2] [3]
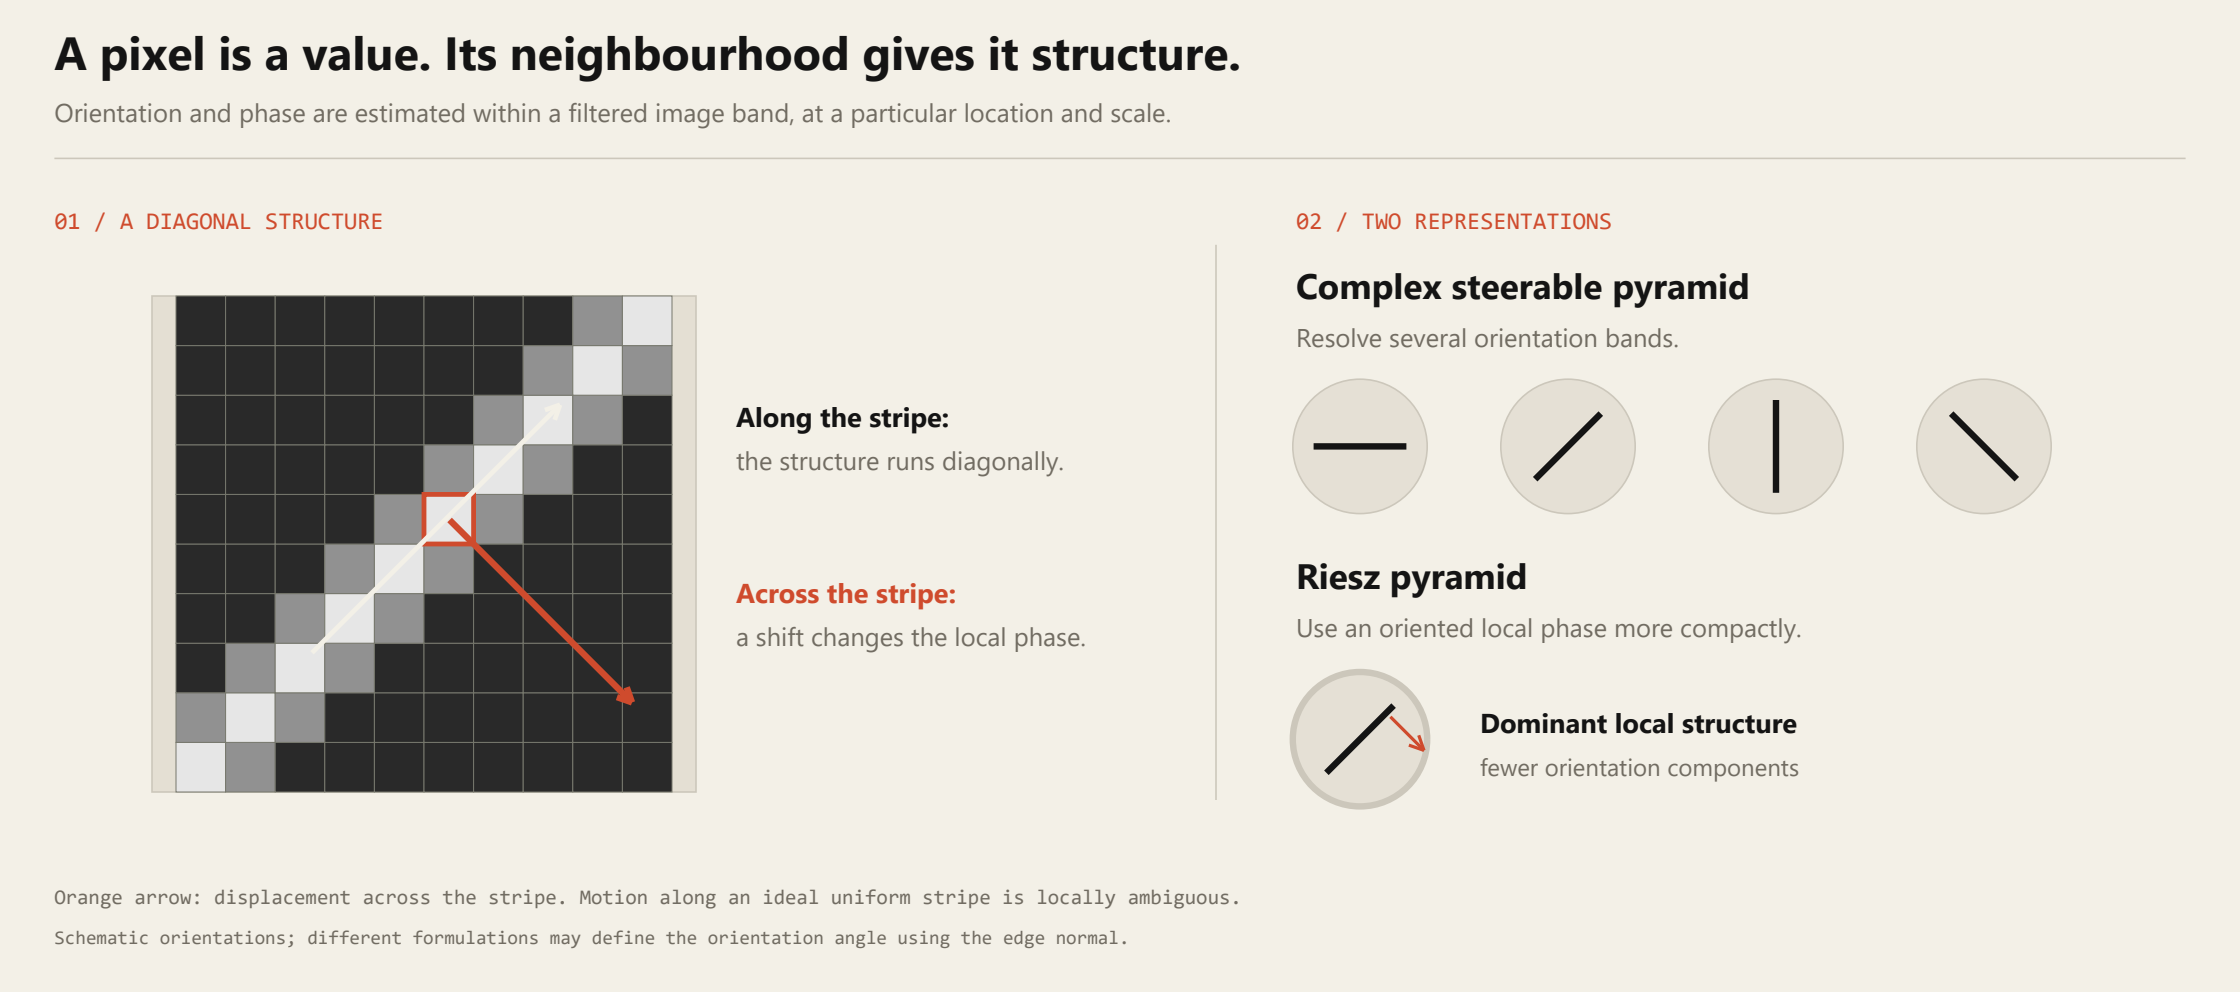
The useful trick is that a small shift of a wave-like image pattern appears as a change in phase. We do not need to assume that the whole object moves in a perfect sine wave. It is the local spatial representation that gives us this relationship.
And the shift does not have to be a whole pixel. The figures below are from my thesis: shifting the continuous signal by just 0.3 pixel changes the values sampled at the same sensor positions. Provided the image has enough structure and the signal is strong enough relative to the noise, that change can be measured.
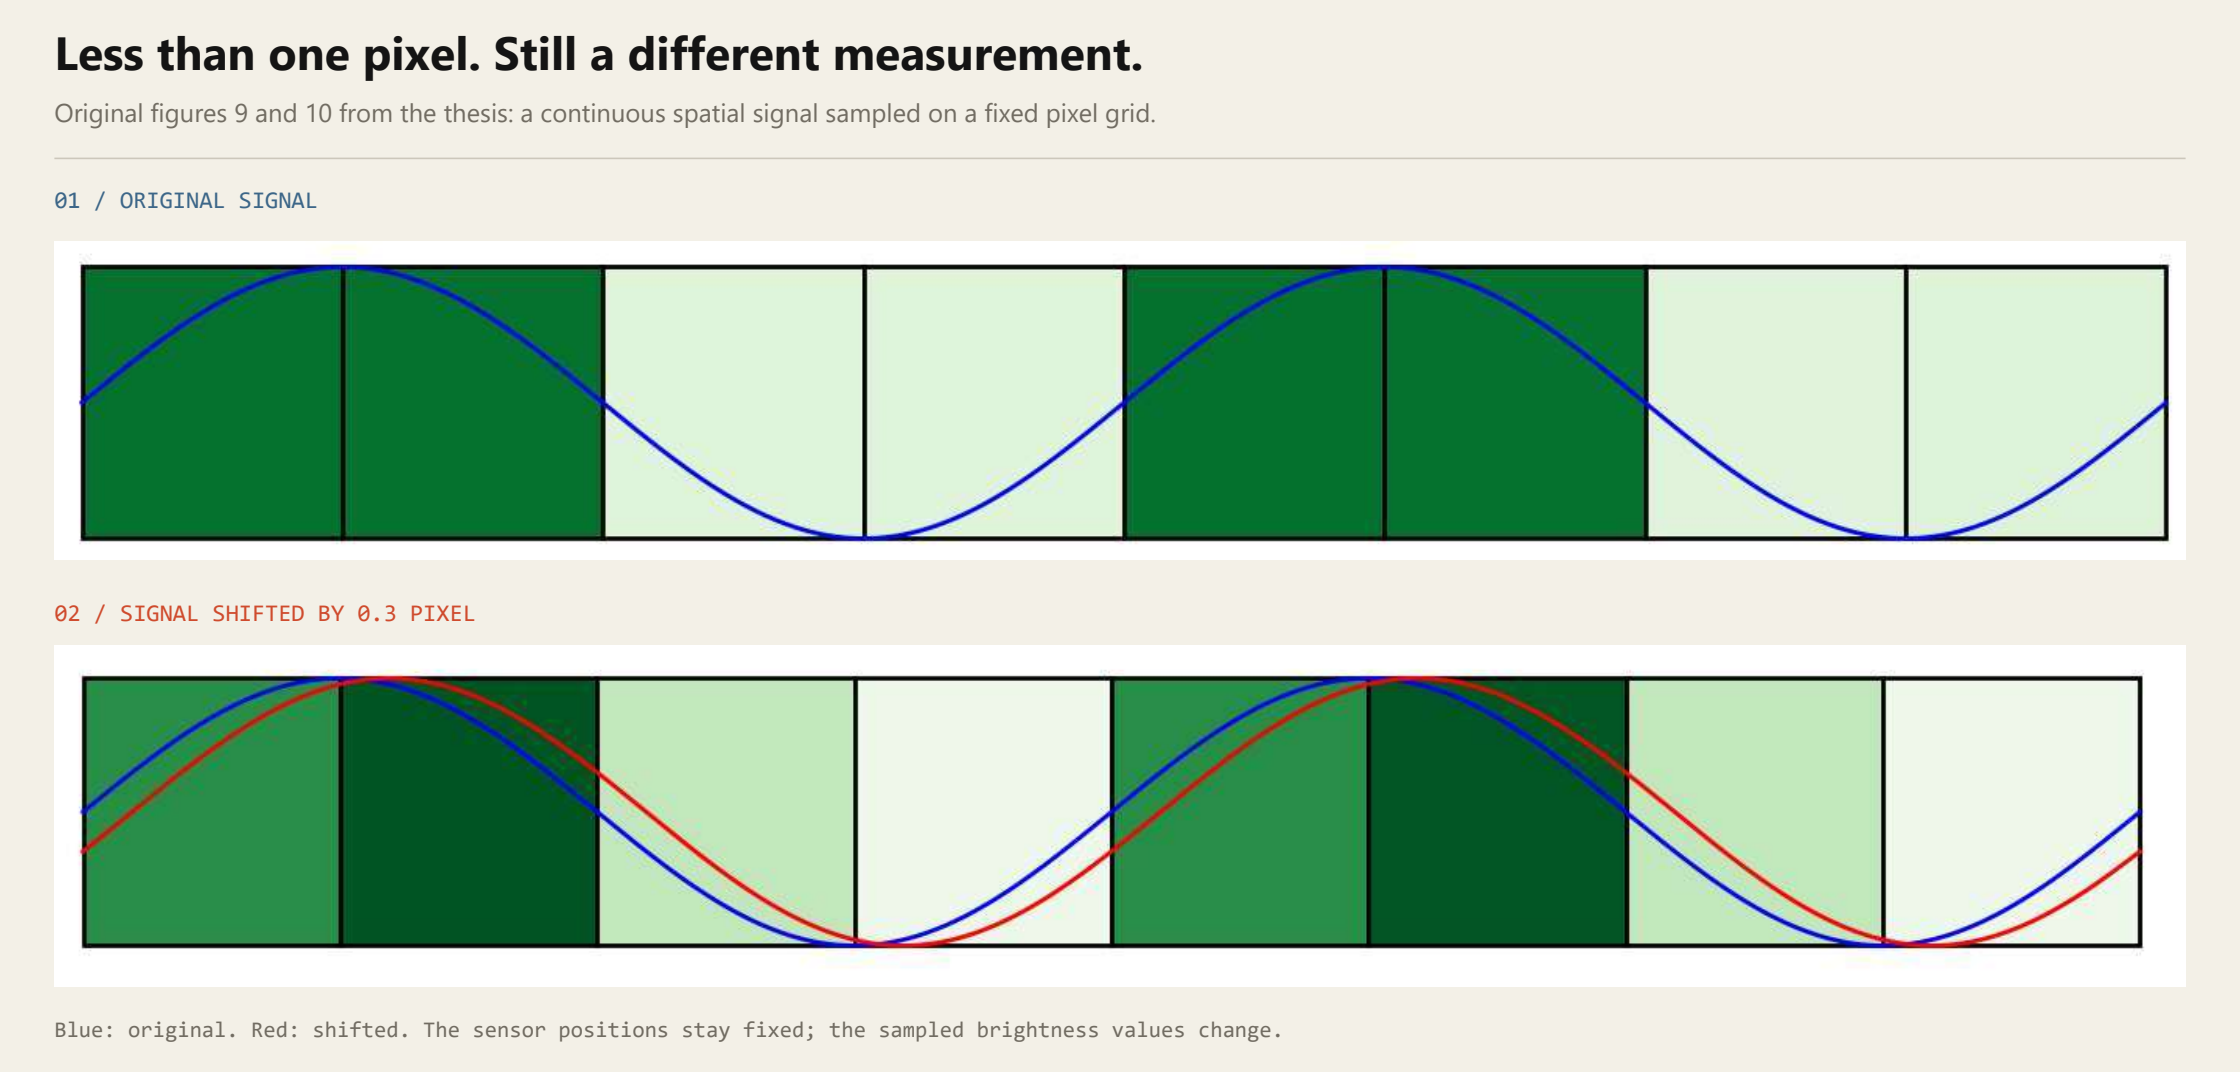
Once we have the phase signal over time, we filter it to keep the frequencies we are interested in, amplify that variation, and reconstruct the frames from the modified pyramid.
Put the frames back together and, finally, we have a motion-amplified video. Boom. The movement that looked like nothing now looks like something.
Making it work.
I implemented my test suite in Python. Thankfully, I did not have to start from scratch: Wadhwa and colleagues provided reference implementations with their publications. Porting and working through those gave me a starting point for comparing the different approaches.[2] [3]
Once the basics worked, I started looking for ways to speed them up. One useful change was switching the colour conversion to OpenCV’s optimised native implementation for a YCbCr representation.[6] Here, Y carries the brightness information, while the other channels carry colour information. That lets the motion-processing pipeline concentrate on the luminance component.
Another useful idea came from a wavelet-based method by Al-Naji, Lee and Chahl: downscale the luminance component before processing it.[5] Fewer pixels mean less work. Obvious once you say it out loud, but still worth testing rather than assuming the result will be good enough.
I adapted these ideas to my Riesz pipeline and compared the changes separately. The colour conversion helped; reducing the luminance resolution made the bigger difference. Combining them produced the fastest version I tested. That was an optimisation of the existing approach, rather than a completely new motion-amplification algorithm.
It also needed a few buttons.
The result is a test application with a CustomTkinter interface: load a video, choose a frequency range, set an amplification factor and inspect the frequency spectrum of selected image regions. OpenCV and NumPy do most of the heavy lifting, while processing the video frame by frame keeps memory use manageable.
Having an actual interface also made it much easier to experiment. Changing a parameter should ideally require turning a knob, not rewriting half a script.
A look at the analysis interface
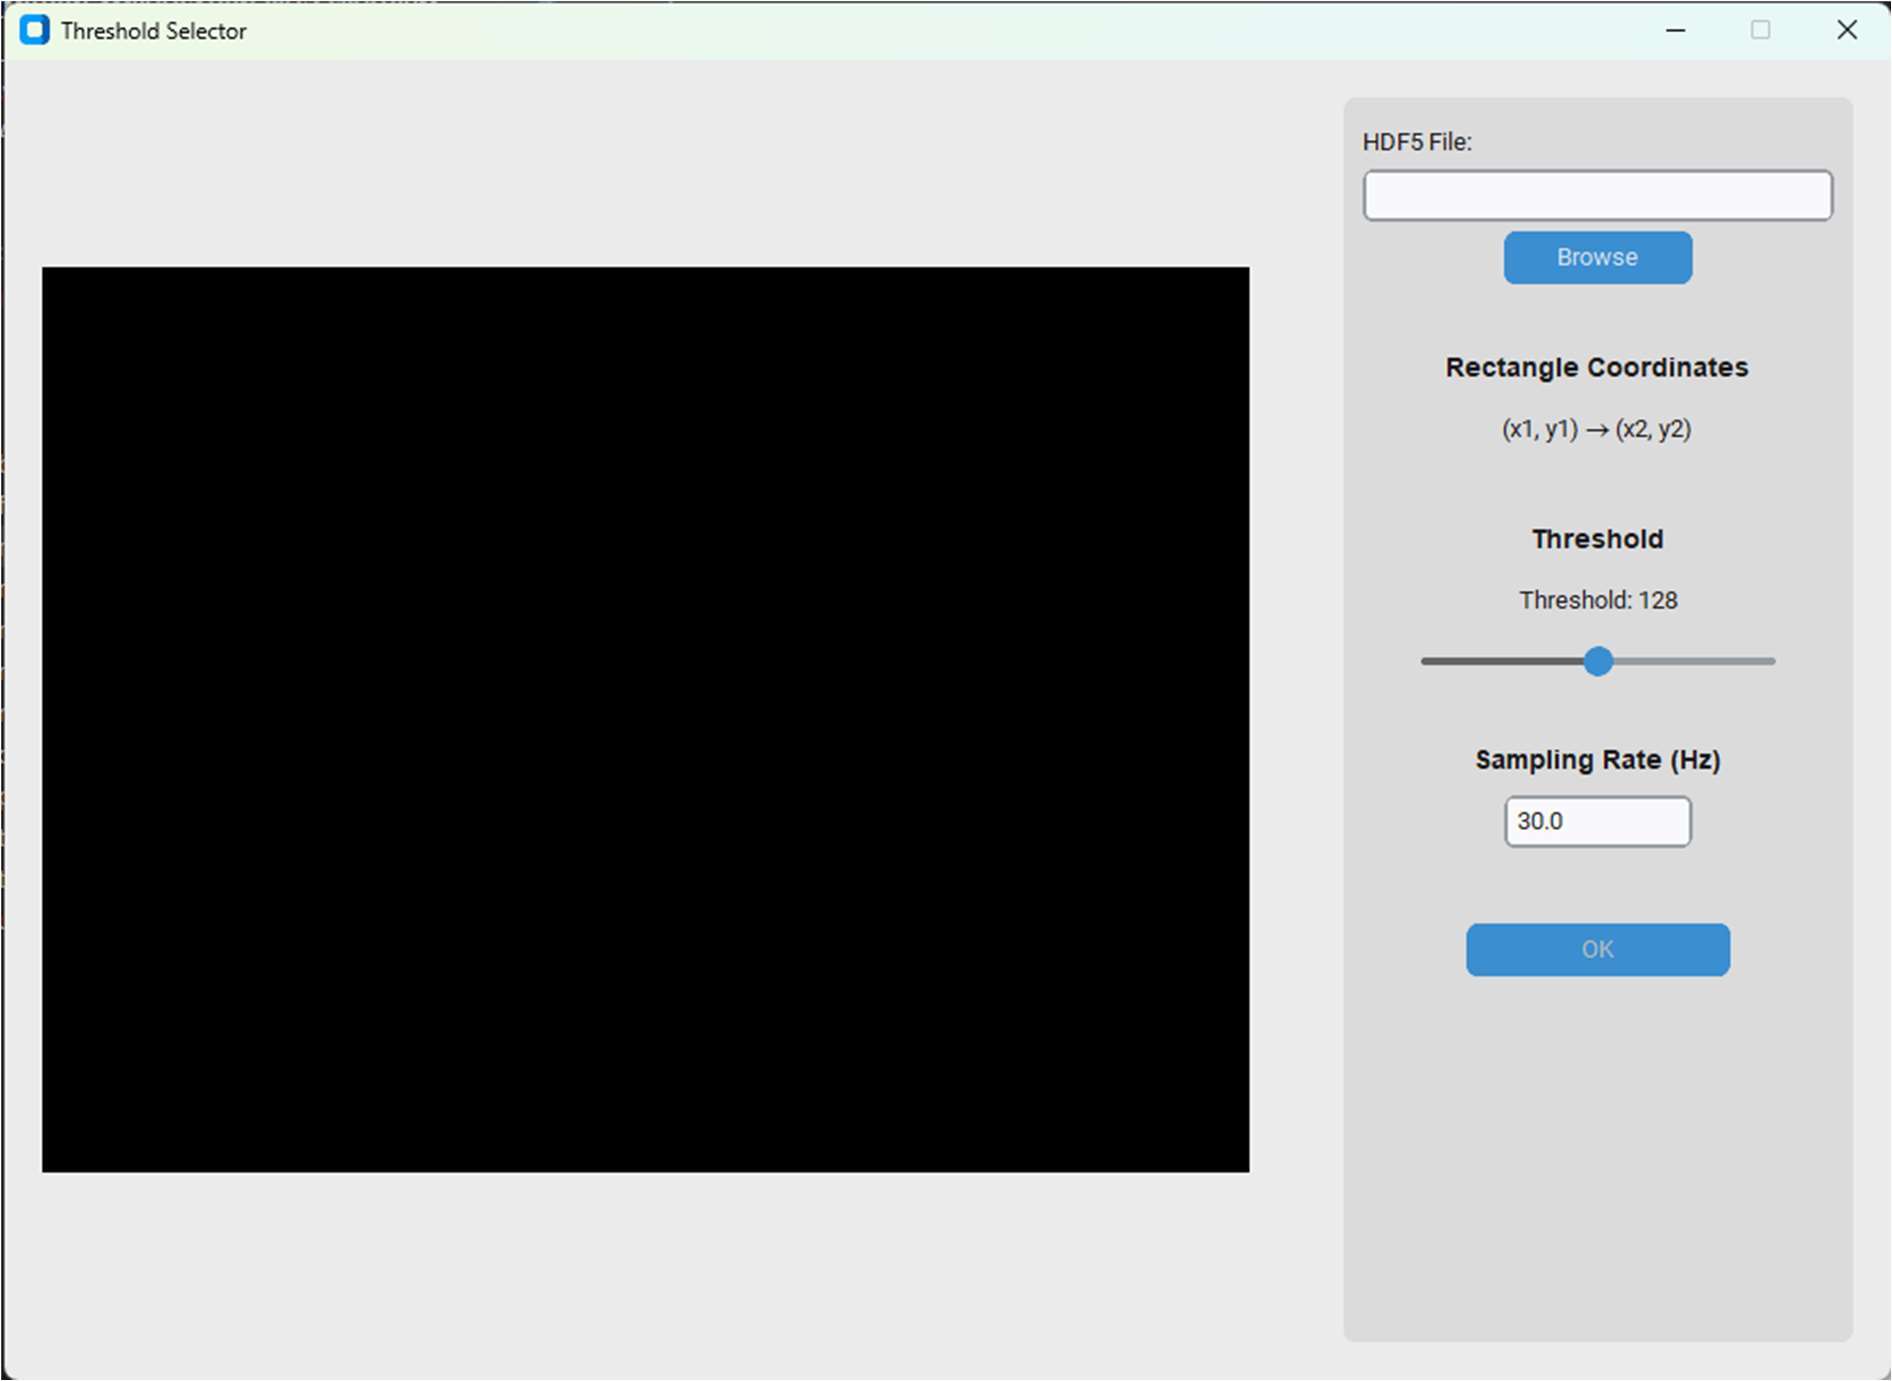
The analysis window from the thesis, figure 23, shown without a loaded dataset.
Check out the code on Github: Repo.
So, does this actually work?
At first glance, some of the displacement sensitivities quoted for commercial systems look rather optimistic. Compare them with a simple calculation of the optical resolution of the camera and lens, and the numbers seem difficult to reconcile.
The important distinction is between resolving two separate details and detecting a shift of the same detail over time. A lens may turn a sharp edge into a slightly blurred transition, but moving that transition still changes the brightness profile sampled by the sensor. We can estimate that change to a fraction of a pixel without suddenly gaining the ability to see an object that small.
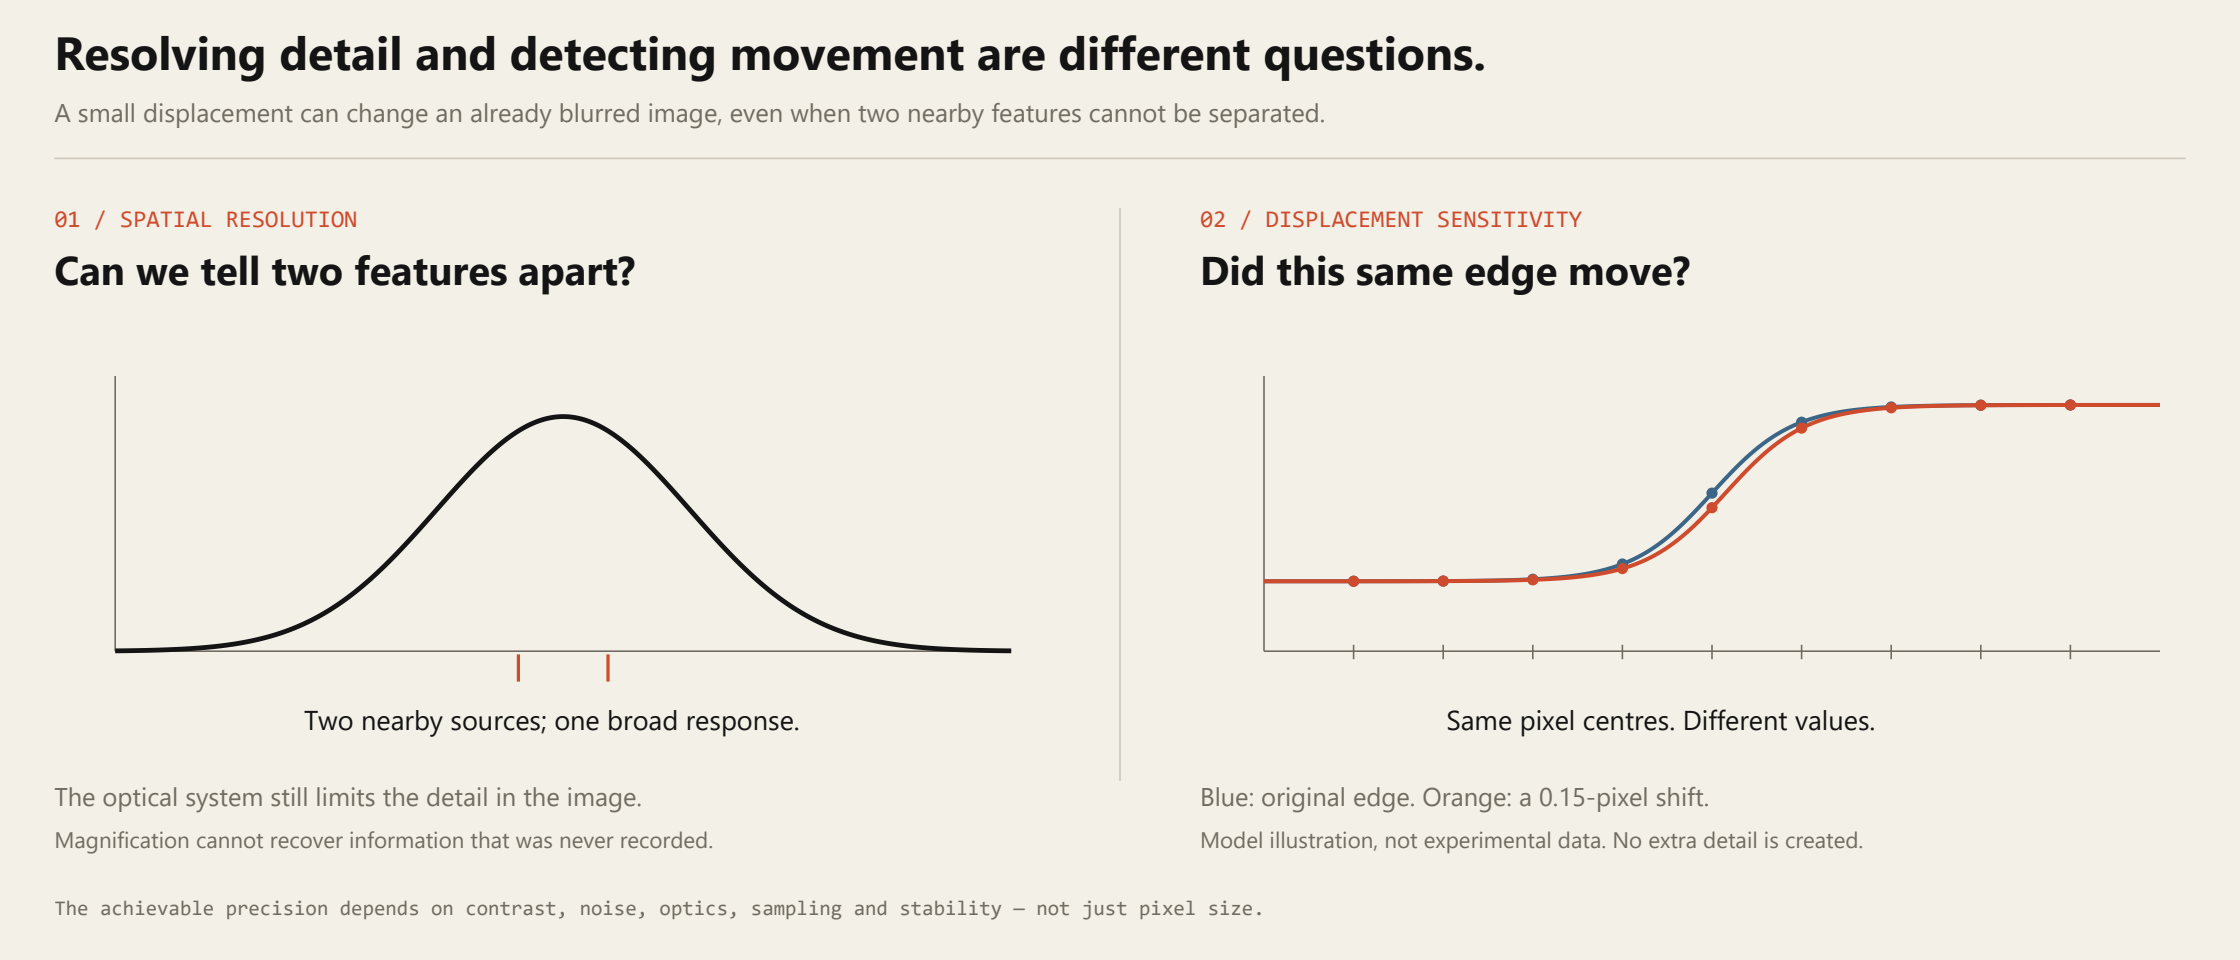
Phase gives us a useful way to measure these changes. Combining information across suitable pixels and filtering it over time can help separate a weak, repeatable motion from noise. It does not create missing information: contrast, lighting, sensor noise, the lens and mechanical stability still set the practical limits.
Fortunately, we had a shaker.
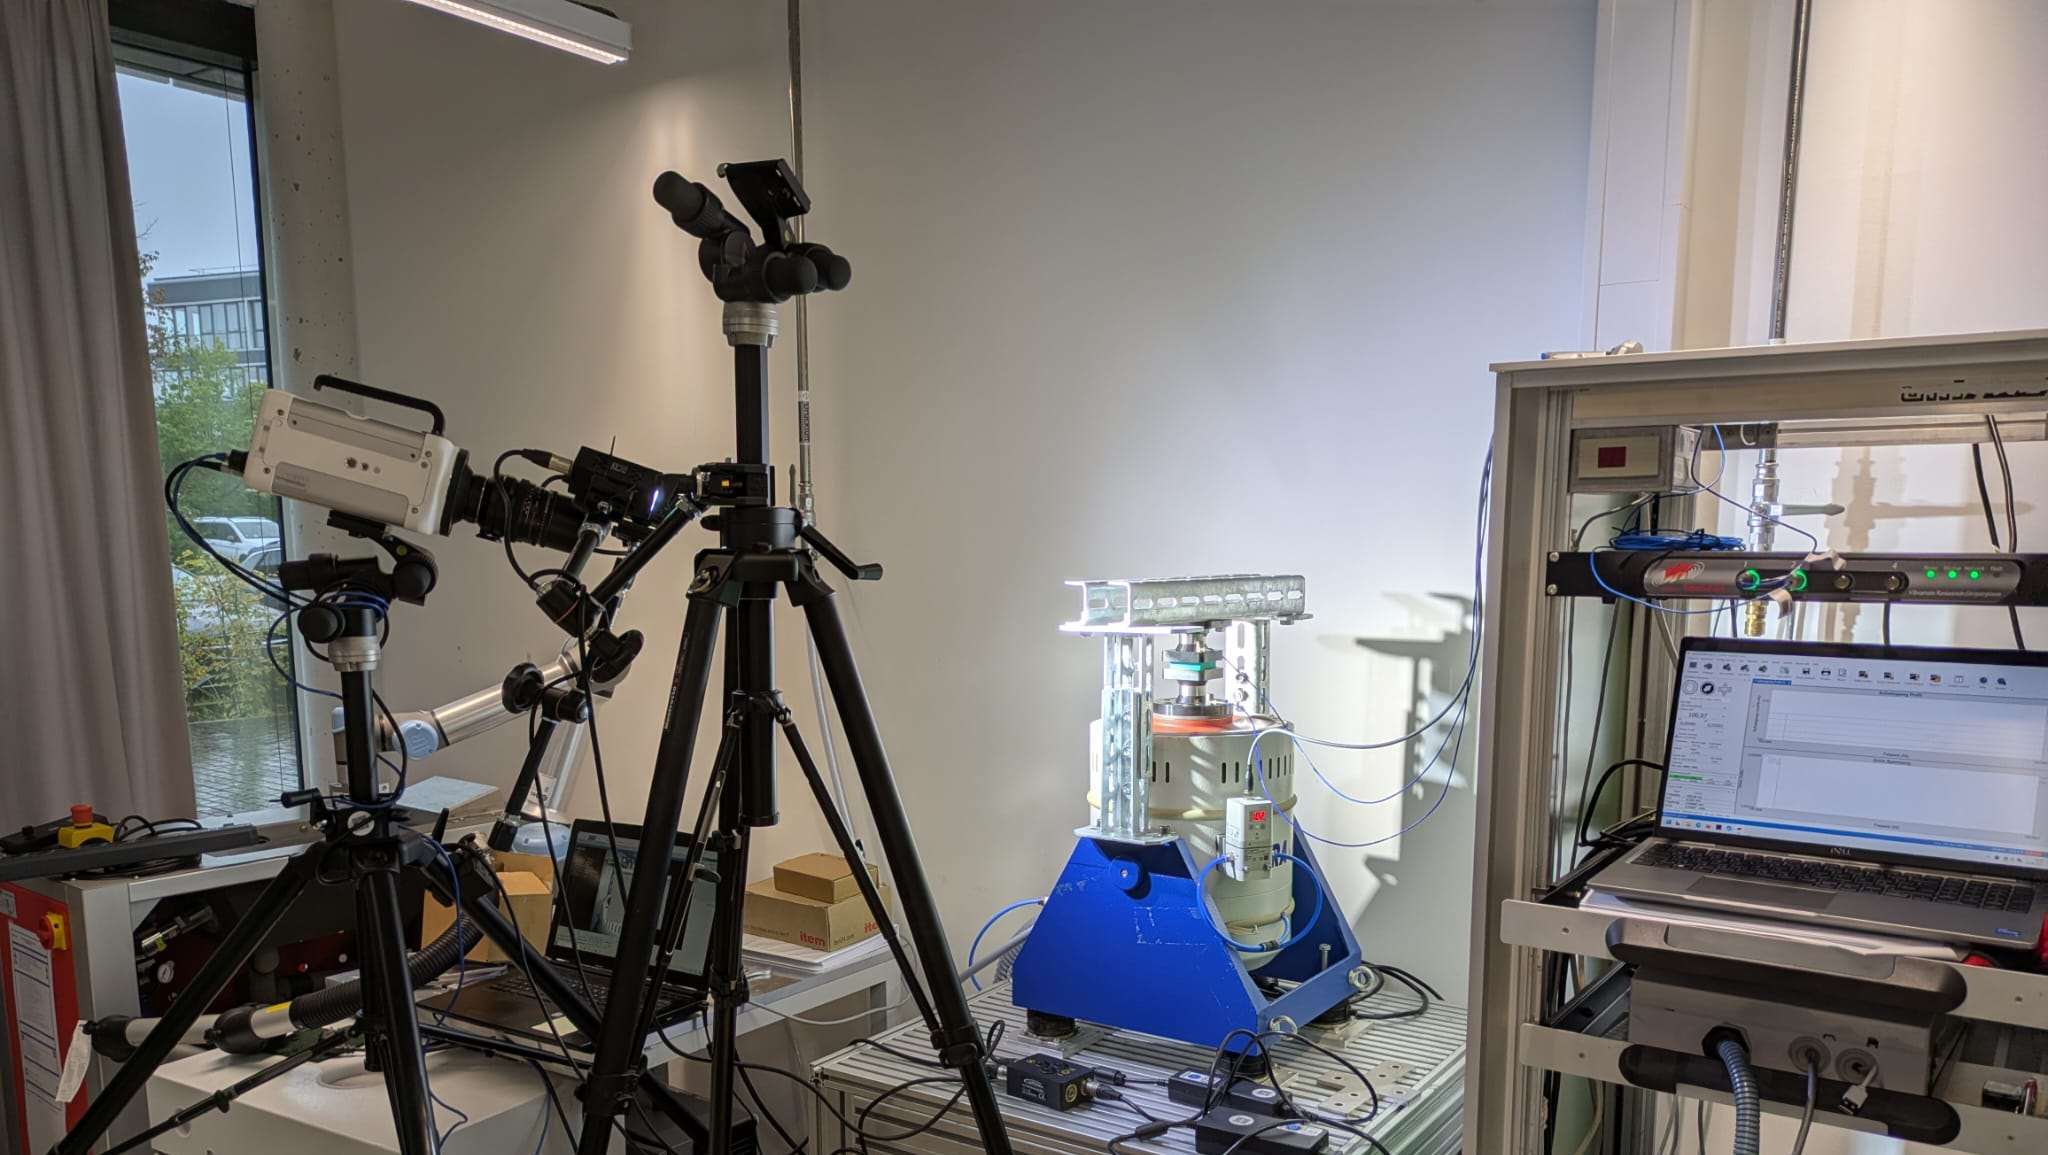
We were lucky enough to have access to an industrial shaker: a machine that produces controlled mechanical vibrations with a specified frequency and amplitude. Much easier to argue with than a human arm. It gave us a known input for testing what the algorithms and the recording equipment could detect.
In the algorithm comparison at 100 Hz, the steerable-pyramid implementation could still detect the smallest reliably generated amplitude we tested: 0.5 µm. Half a micrometre. That was the lower end of our test range, so it does not establish the algorithm’s absolute limit. The Riesz variants reached 12.5 µm in that same comparison.[7]
| Implementation | Smallest detected test amplitude |
|---|---|
| Complex steerable pyramid | 0.5 µm |
| Riesz variants | 12.5 µm |
Thesis, table 6. Detection was assessed from the visible spectral peak at the known excitation frequency. These are setup-specific detection results, not a universal displacement-accuracy specification.
The recording equipment mattered as well. In the separate lens tests, the better fixed-focal-length lenses generally retained clearer peaks at small amplitudes than the tested zoom lens. In the camera comparison at 10 Hz, the smaller-pixel cameras tended to do better. That is a result for this setup, rather than a rule that smaller pixels always win: sensor properties, noise and how the subject is projected onto the sensor all matter.
The phones were less cooperative.
Our smartphone attempts, on the other hand, failed rather impressively. My suspicion was that I had not managed to disable all of the image stabilisation, despite trying. A phone does quite a lot between receiving light and saving a video. Some of that processing could alter the tiny changes we were looking for.
We did not isolate the cause well enough to prove that explanation. There is related work on preparing and stabilising videos for pulse measurement, including Alzahrani and Whitehead’s preprocessing study, and on stabilising handheld recordings without smoothing away the breathing motion.[8] [9] Those are useful starting points for the problem; they do not prove what the built-in stabiliser in our particular phones was doing.
And what about an actual pulse?
You may have seen the webcam demonstrations that estimate pulse from a person’s face. Those usually exploit tiny changes in the light reflected by the skin as blood volume changes with each heartbeat. It is tempting to describe this as the head flashing red, but the signal is more subtle than that: the green channel often carries a stronger pulse signal, and methods can combine information from several colour channels.[10]
We wanted to investigate the mechanical side instead: could we extract a pulse-related signal from the movement of the skin at the wrist? With the arm supported and the camera held stable, we could extract an oscillatory component at roughly 1 Hz, or 60 beats per minute.
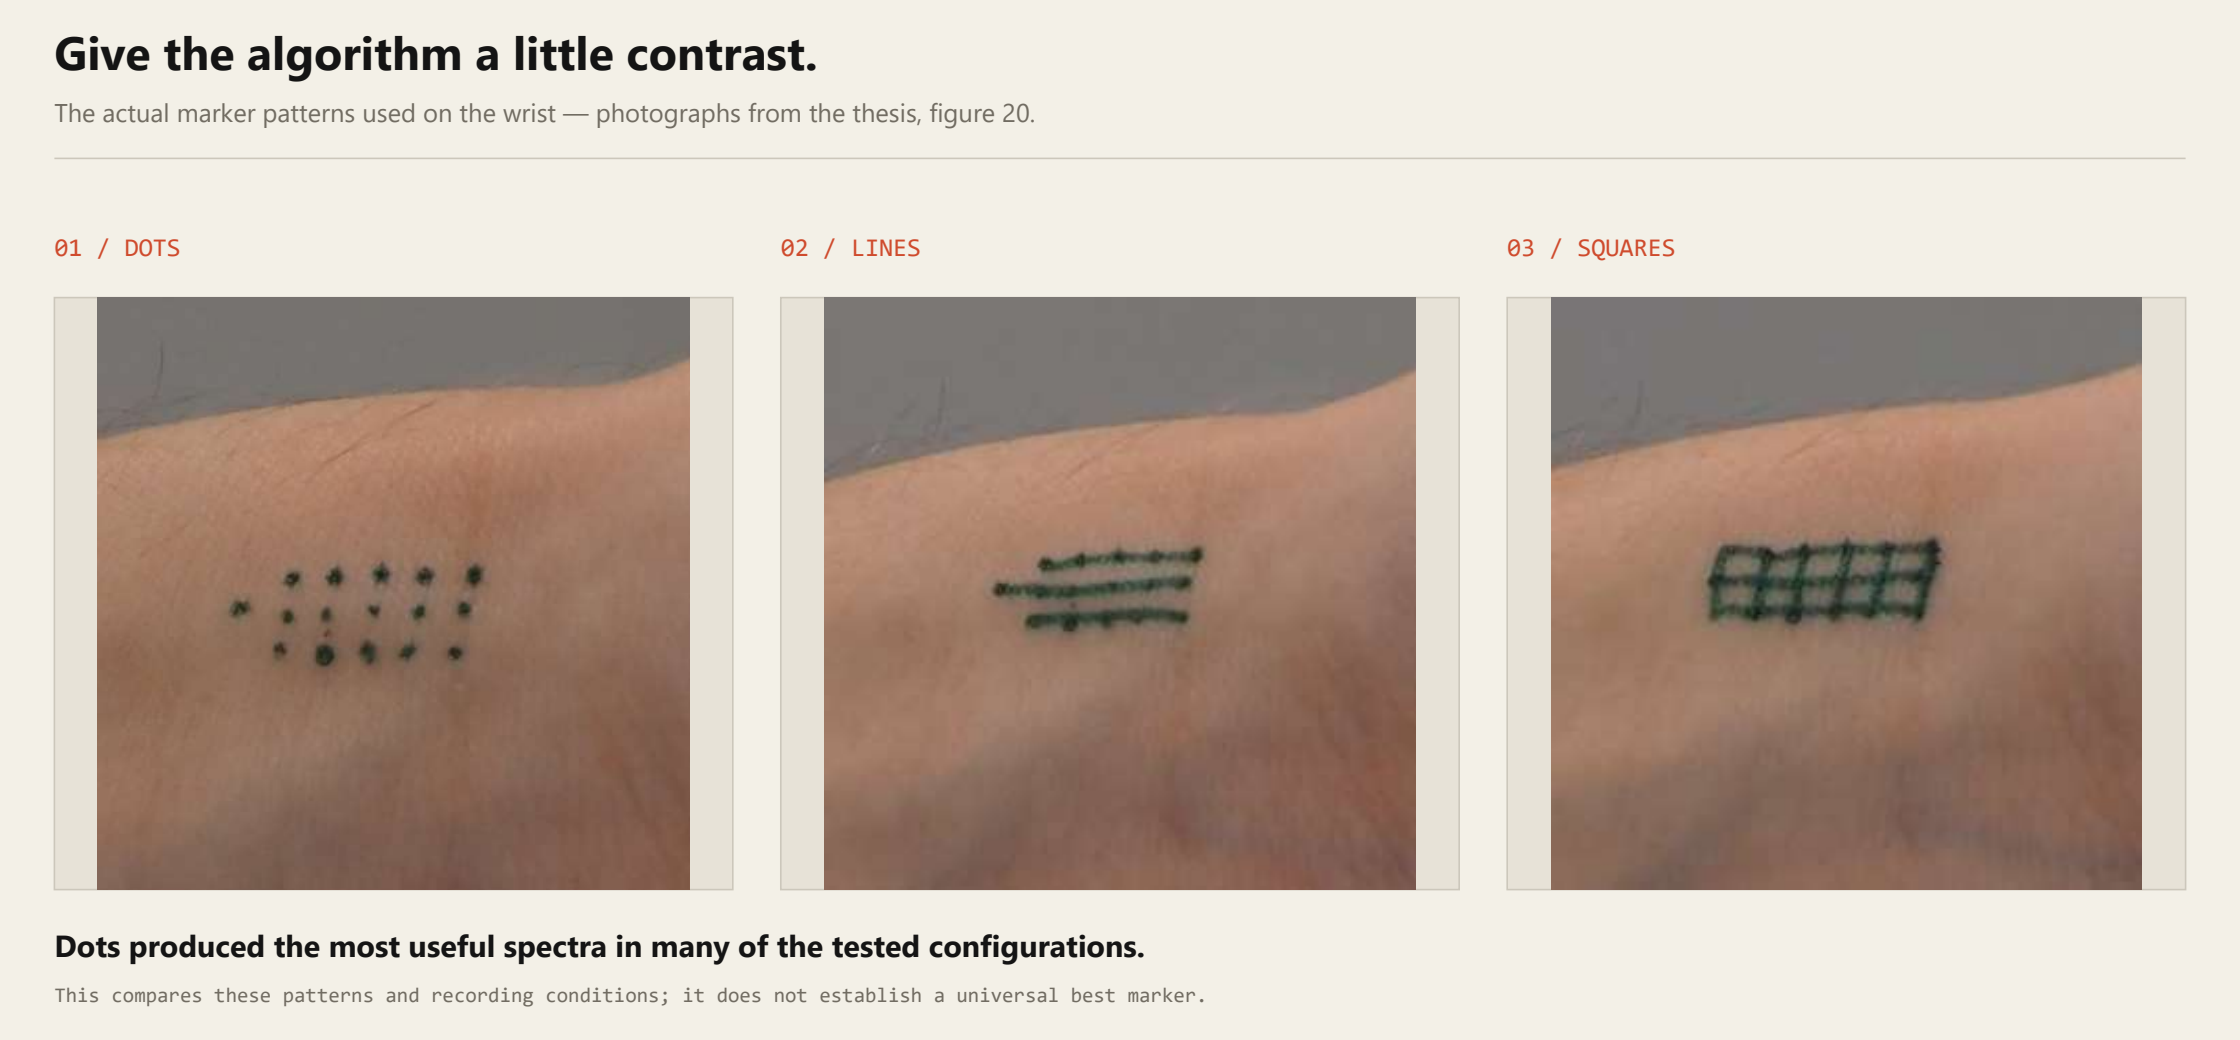
We did have to give the algorithm a little help. I painted different patterns onto the skin: squares, parallel lines and dots. To my surprise, the dots gave the most useful results in many of the tested configurations. Apparently, a few small marks can do quite a lot for an image-processing problem.
The signal was separated into oscillatory components using Empirical Mode Decomposition, and a component in the expected pulse-frequency range was selected. That was a small success, with an important footnote: the tests involved one participant, the component was chosen manually, and we did not validate the reconstructed waveform against a reference pulse waveform. A rhythm in the right frequency range is encouraging; it is not yet a validated pulse measurement.
The extracted signal component from the thesis
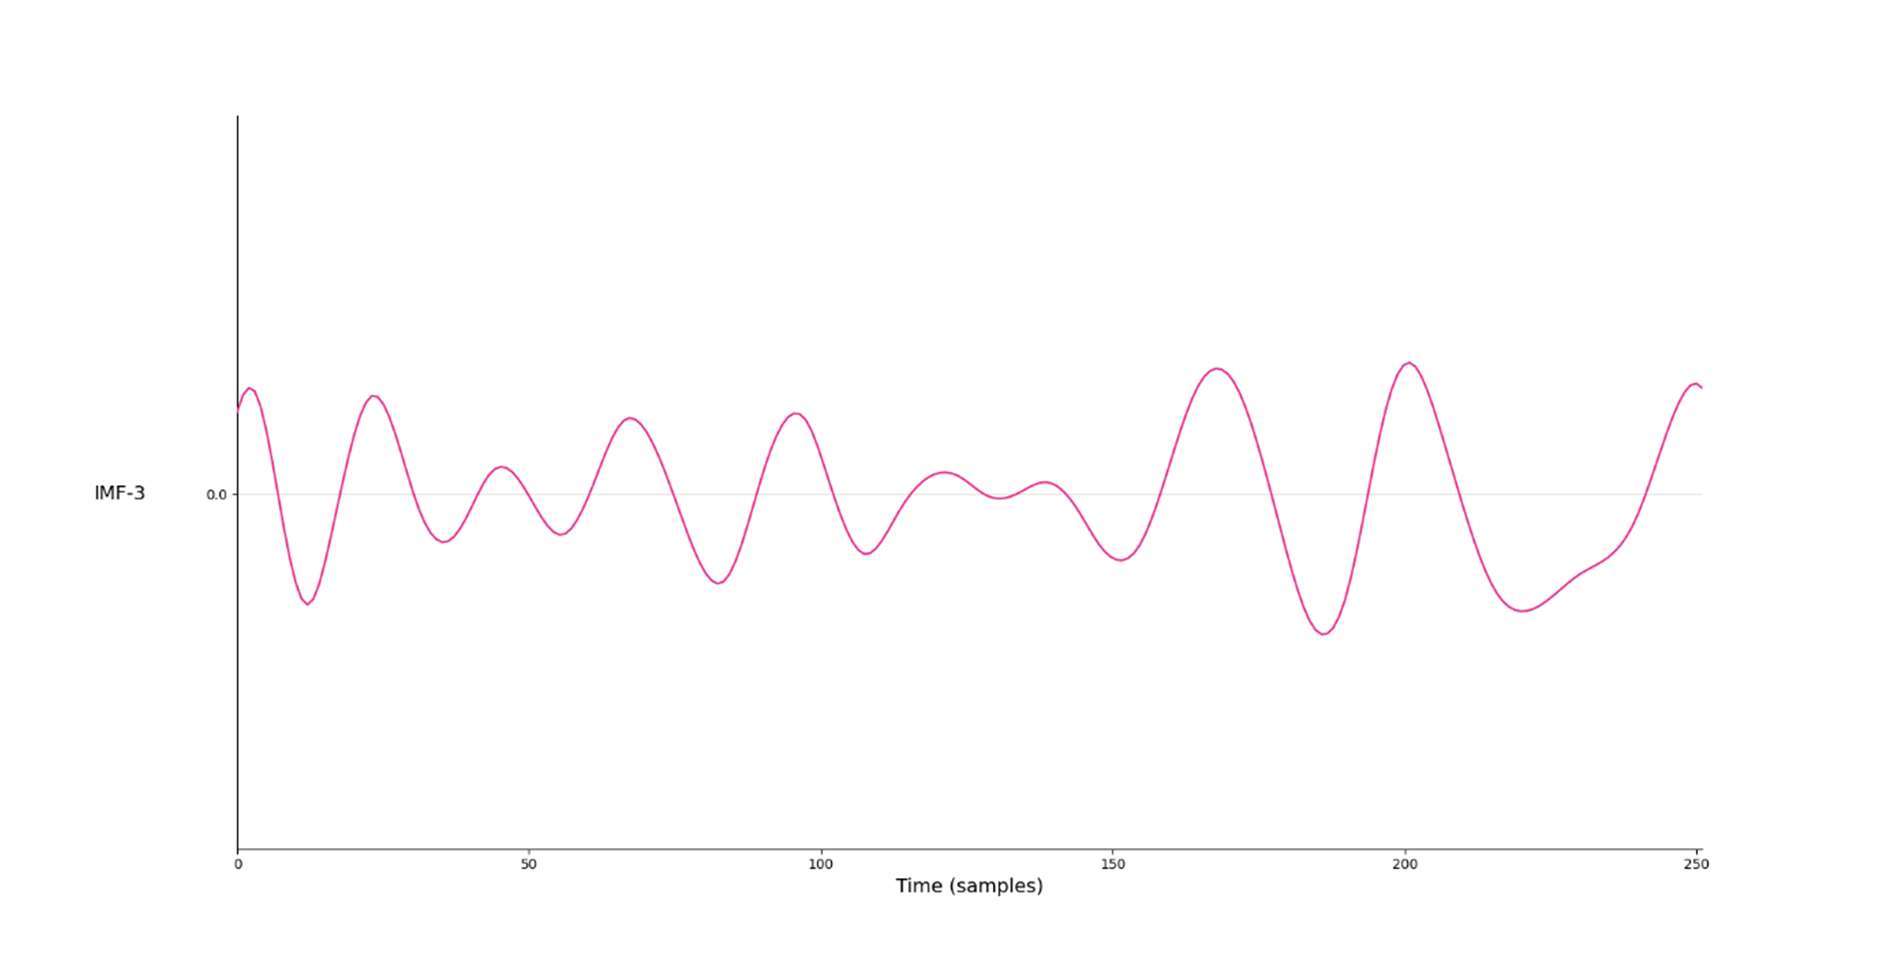
Thesis, figure 28. The horizontal axis shows sample number. The selected component was interpreted as potentially pulse-related; no reference waveform is shown.
What’s next?
This is definitely one of those techniques that makes me wonder why I had not heard more about it sooner. There is plenty to get right—lighting, camera angle, focus, stability and a subject that stays reasonably still—but when it works, it does look a little like magic.
A mobile app is an obvious possibility. More direct control over the camera and its processing would make it easier to find out which parts of the phone’s imaging pipeline help, and which get in the way. Access to the right camera controls would be a starting point, not an automatic solution to the signal-quality problem.
Another possibility is a field hospital, with one fixed camera looking at several people on separate beds. Each person would have their own analysis region, with pulse and respiratory rate shown in small monitor panels. Something like this:
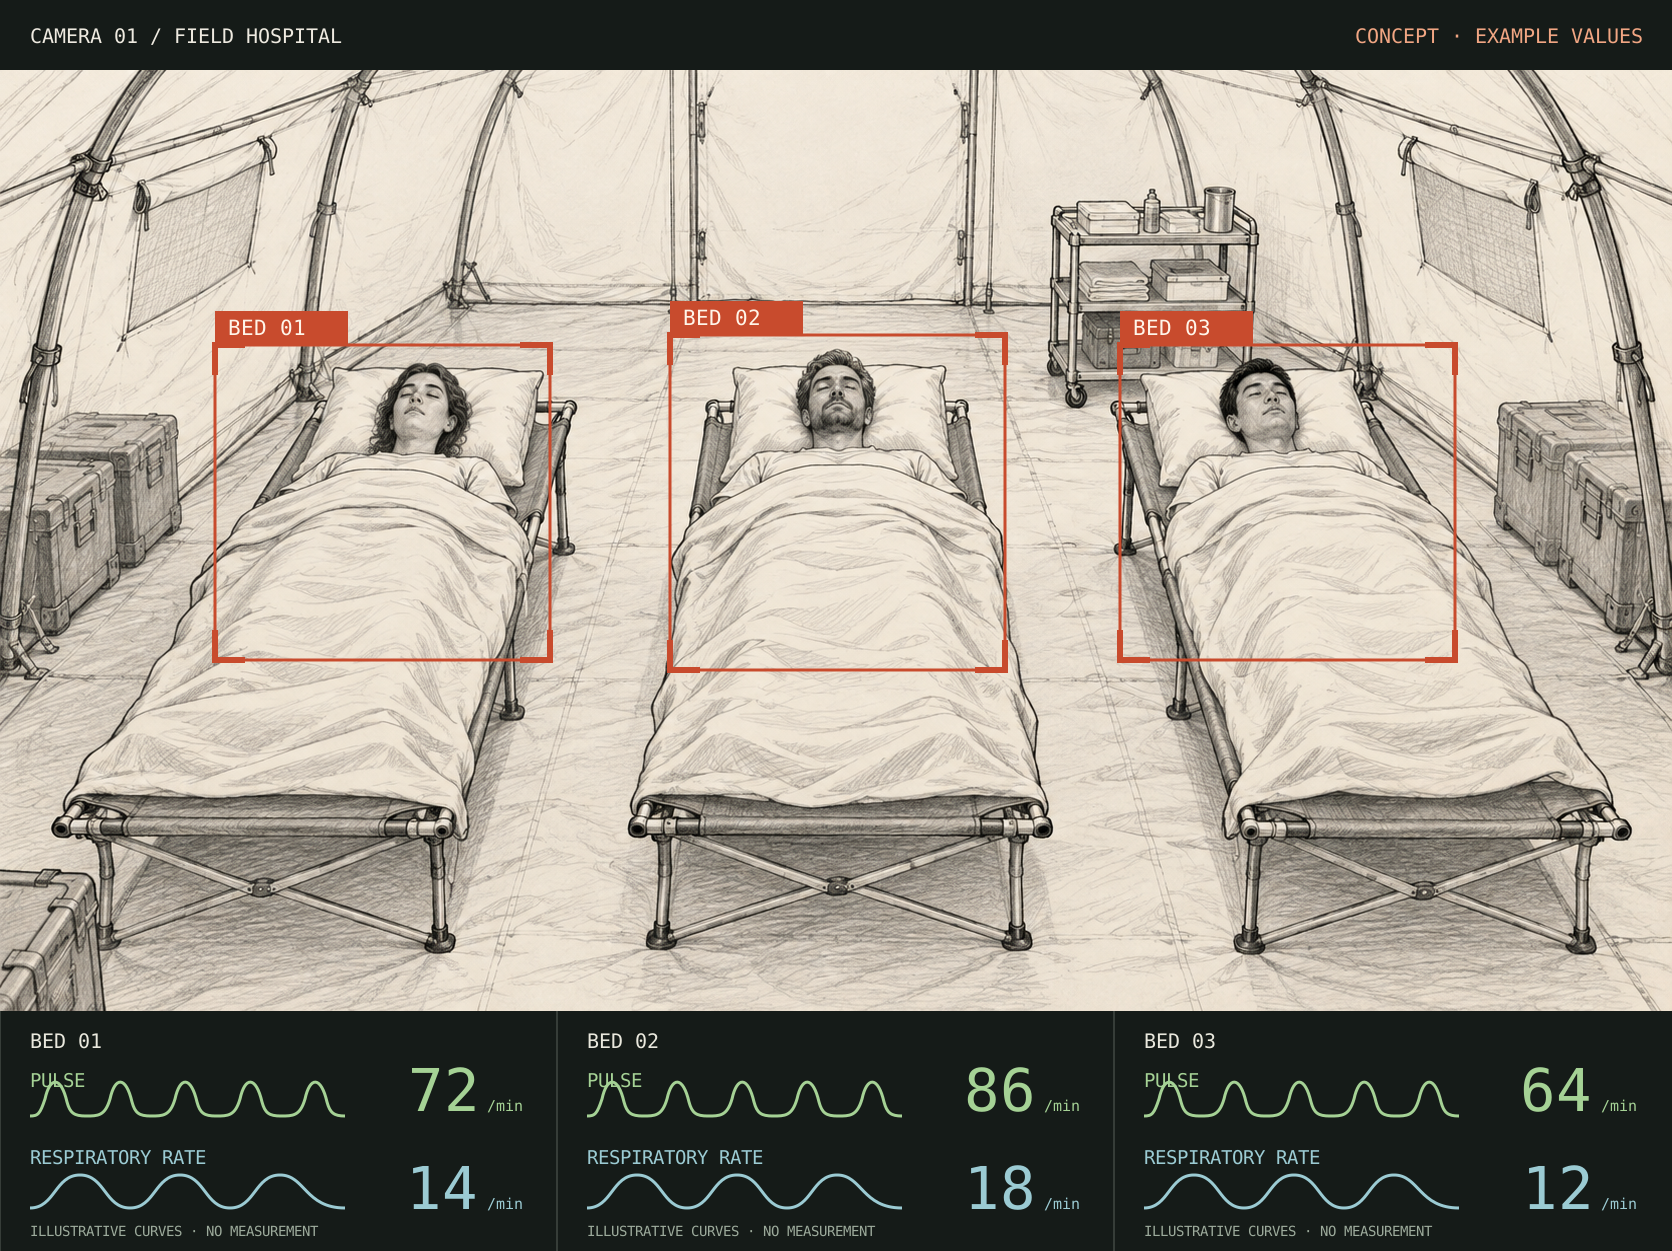
That scenario still needs considerably more work. A wide view leaves fewer pixels per person, people move, blankets obscure useful regions, and a system has to recognise when it does not have a usable signal. Simultaneous monitoring of several patients was not tested in this thesis.
Or it could simply be useful in the home workshop. If a machine is making a funny sound, seeing which part is actually moving is a rather appealing way to start looking for the cause.
The stationary-subject limitation is also not the end of the story. Commercial RDI systems, such as those distributed by VIMS, offer transient motion amplification and object-path plots for objects moving through a scene.[11] Following an object while preserving and amplifying its small residual movements is something I would love to explore. But that would be a whole other project.
Further reading
- Davis et al. (2014): The Visual Microphone: Passive Recovery of Sound from Video. The bag-of-crisps experiment, with example recordings and recovered audio.
- Wadhwa et al. (2013): Phase-Based Video Motion Processing. Complex steerable pyramids, phase-based magnification and reference code.
- Wadhwa et al. (2014): Riesz Pyramids for Fast Phase-Based Video Magnification. A compact representation for faster processing.
- Feng et al. (2023): 3D Motion Magnification: Visualizing Subtle Motions with Time-Varying Neural Fields. Reference 46 in the thesis; the learning-based 3D direction mentioned above.
- Al-Naji, Lee & Chahl (2018): An efficient motion magnification system for real-time applications. Reference 57 in the thesis; a wavelet-based approach that informed the luminance-processing optimisation.
- OpenCV: colour conversions. The API names this representation
YCrCb; the two chrominance channels appear in the reverse order to the name YCbCr. - Sebastian Schütz (2026): Implementierung und Evaluierung eines Motion Amplification Systems zur Anwendung in der Medizintechnik. Bachelor’s thesis, University of Tübingen / University of Stuttgart, IFF / Fraunhofer IPA. Background, implementation and results: sections 2.4, 3.2, 4.2–4.5 and 5.8–5.10. Figures 9, 10, 12, 20, 23 and 28; table 6.
- Alzahrani & Whitehead (2015): Preprocessing Realistic Video for Contactless Heart Rate Monitoring Using Video Magnification. Reference 77 in the thesis. A related study of preprocessing for pulse measurement; not a diagnosis of our phones’ built-in stabilisation.
- Alam, Singh & Abeyratne (2017): Considerations of handheld respiratory rate estimation via a stabilized Video Magnification approach. Reference 76 in the thesis; discusses camera-motion correction without smoothing away the desired signal.
- Verkruysse, Svaasand & Nelson (2008): Remote plethysmographic imaging using ambient light. Explains pulse information in reflected skin light, including the strong green-channel signal.
- VIMS, distributor of RDI systems, and RDI’s Iris MA product information. Manufacturer descriptions of transient motion amplification, path plots and other features; not an independent performance comparison with this thesis.
Mostly functional. Rarely finished.